Good day…
What a week it has been for the crypto markets…there were ups and there were very significant DOWNS!
The price performance of Ethereum and Bitcoin does have leading impact on overall sentiment of other cryptocoins and tokens. As such we will be publishing weekly ETH and BTC to help our readers identify buying and selling opportunities in coming days.
Let’s start with Bitcoin…
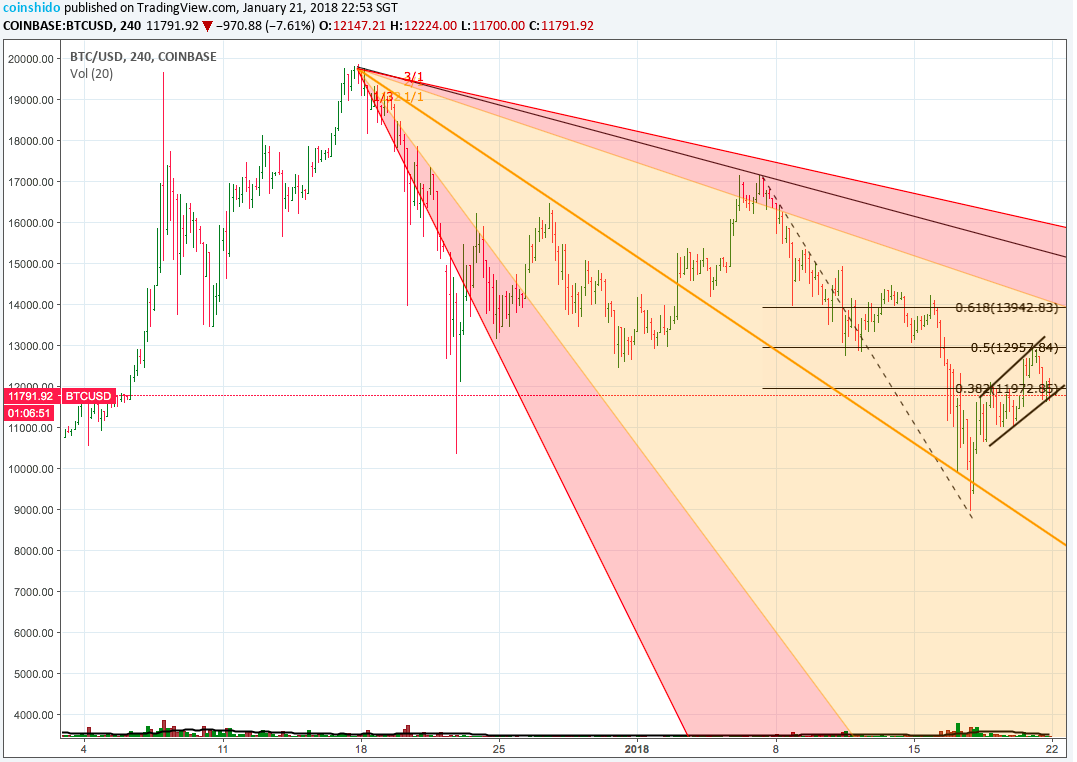
BTC/USD 4 hours chart analysis
- Down trend line from all time high 20,000 remain valid
- Bearish rising channel/rising wedge formation
- A close below 11,640 this week will expose further price drop to 9,000
- Short term sentiment is bearish

Key swing trade zones:
- R2 : 14,200
- R1 : 13,300
- S1 : 11,640
- S2 : 9,000
Trade idea : Neutral (sideline) and wait for opportunity to buy on dips.
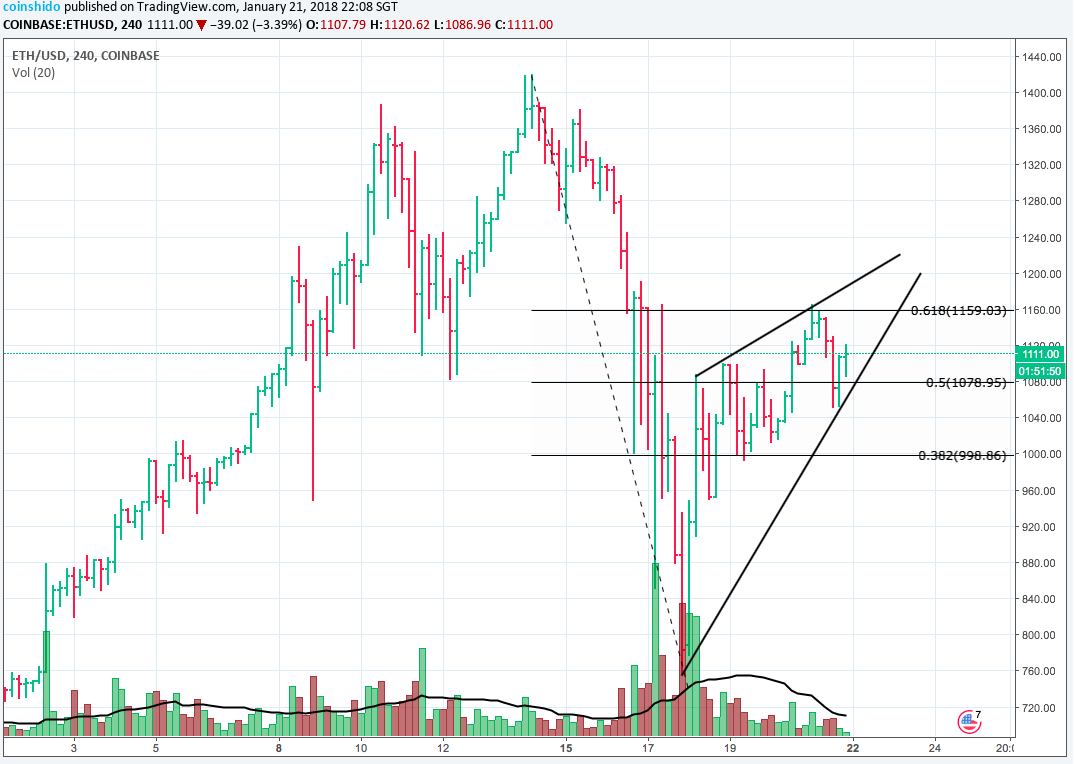
ETH/USD 4 hours charts analysis
- Bulls not convinced with recent ETH upmoves
- ETH up moves not supported by significant volume increases
- Bearish Rising wedge formation indicates continuation of downward bias:
Key swing trade zones:
- R2 : 1240
- R1 : 1160 (61.8 pct fibonacci)
- S1 : 1078
- S2 : 1000
Trade idea : Neutral (sideline) and wait for opportunity to buy on dips.

Original article and pictures take coinshido.com site
Комментариев нет:
Отправить комментарий